ABOUT RETAIL AUDIT


Average Number of SKU per Store shows performance of entire brand portfolio presence in the outlets. When talking about Traditional Trade channel (especially Kiosks and Convenience stores), it typically shows number of facings or strongly correlates with the number of facings. If an indicator of Brand Distribution reflects the horizontal development of distribution, then Average Number of SKU demonstrates the vertical development of distribution.
To calculate of Average Number of SKUs we need to sum up Numeric Distribution of all SKUs and divide by Numeric Distribution of the Total Brand
Example:
| Dec.16 | |
|---|---|
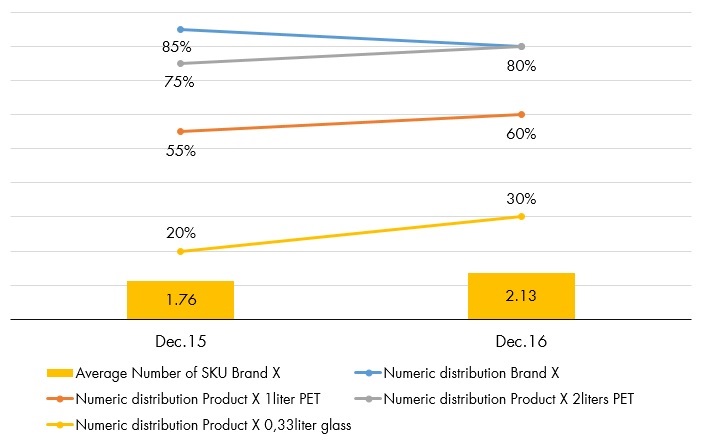
| Numeric distribution Brand Х | 80% |
| Numeric distribution Product Х 1liter PET | 60% |
| Numeric distribution Product Х 2liters PET | 80% |
| Numeric distribution Product Х 0,33liter glass | 30% |
Average number of SKU Brand X = (60%+80%+30%)÷80% = 2,13
In practice this KPI is used to monitor quality of brand distribution and for root-cause analysis when other measures can’t explain brand performance.
Example:
Brand X Numeric Distribution is declining while distribution of all its SKUs is going up. It is explained by the growth of Average Number of SKUs
Note: Please take into account that Average Number of SKUs is subject to seasonal fluctuations (similar to other indicators of Numeric Distribution), albeit to a lesser extent.