ABOUT RETAIL AUDIT

Concentration curve of the category sales is a graphical reflection of the cumulative dependence betweenthe category sales volume and numeric distribution. To build it, we need to reflect the accumulated sales of the category by retail outlets sorted from he biggest to the smallest in terms of category sales.
How can we use the concentration curve? First, it allows us to identify what percentage of stores are responsible for what percentage of category sales.
Example:
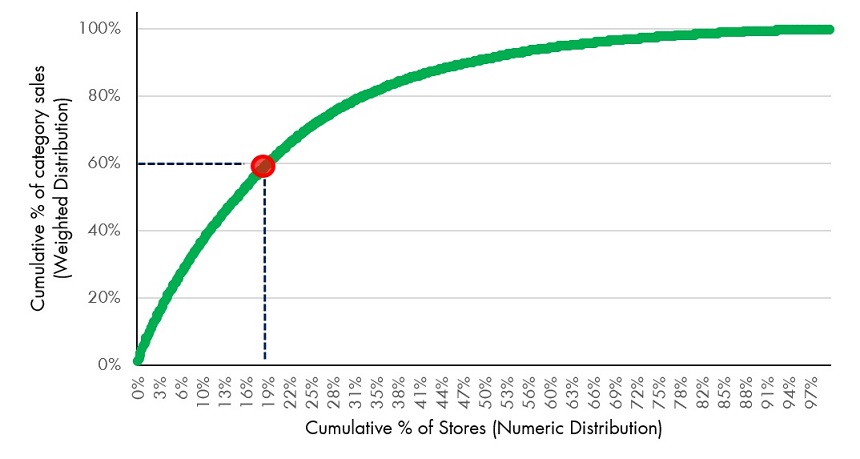
Above graph shows that ~ 19% (20%) of outlets are responsible for 60% of sales of the category. In this example Pareto rule (suggesting that 20% of store deliver 80% of sales) doesn’t work, the ratio is 20% to 60%. Moreover, in practice you will see that it will never be exactly 20/80.
You can also compare category curves for different markets or different categories in one market to identify which market/category is more concentrated, it will help to differentiate strategies in distribution building. Same logic can be applied to build concentration curves for particular brands or products.
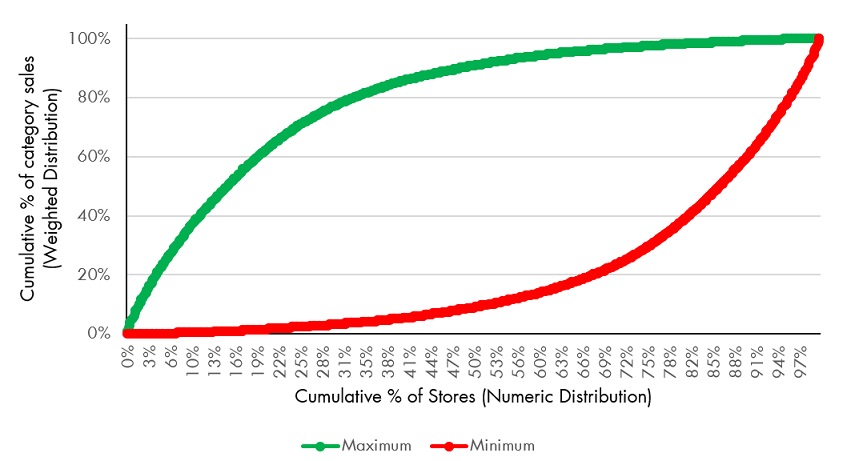
But typically concentration curves used for evaluation of brand distribution efficiency. Above concentration curve demonstrates the best possible scenario, e.g. brand with 20% numeric distribution can’t reach more than 60% weighted distribution and this maximum is achievable only in the case brand is placed in the best (top) 20% of stores.
To evaluate distribution efficiency we need to build additional curve, a mirror reflection of the previous one to reflect the worst scenario (or minimal possible weighted distribution per numeric distribution point). For this purpose we sort stores from biggest to smallest in terms of category sales.
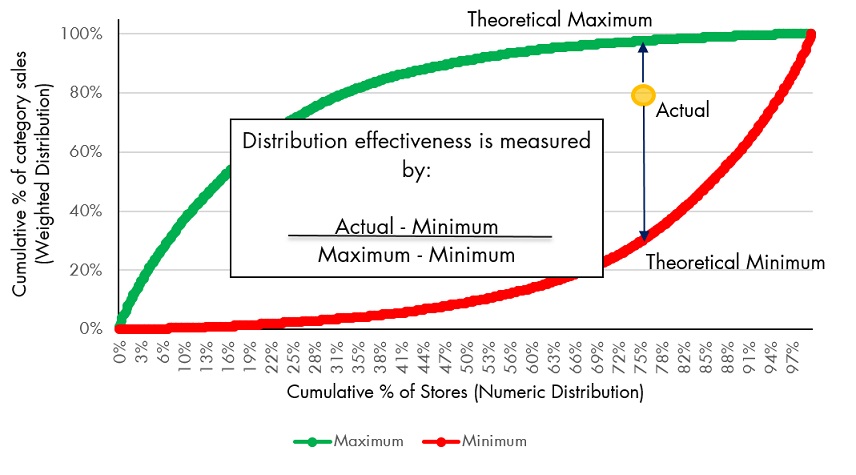
Ratio between the actual value of weighted distribution and maximum and minimum possible levels will help to calculate the distribution efficiency factor:
Example:
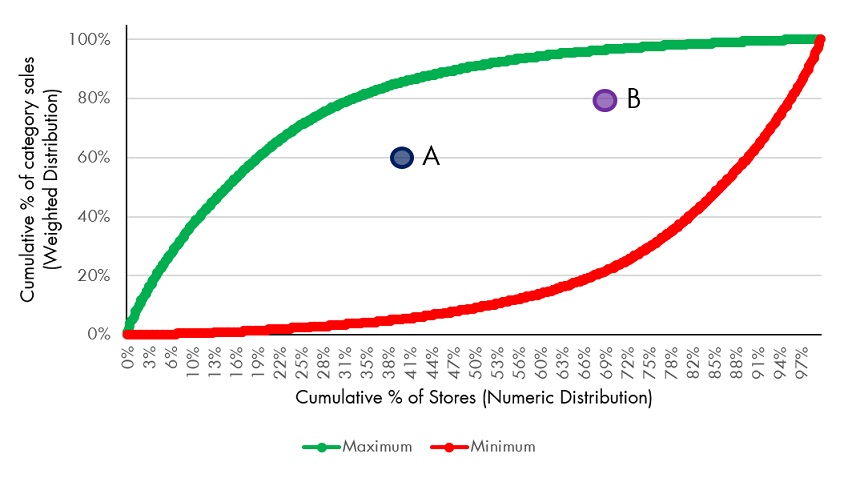
For Brand A:
Numeric Distribution = 40%
Weighted Distribution = 60%
Minimum and Maximum Weighted Distribution levels = 5,5% and 85,5% accordingly
Weighted Distribution Efficiency index = (60%-5,5%) / (85,5% -5,5%) = 54,5% / 80% = 0,681
For Brand B:
Weighted Distribution Efficiency index will be (80% -22.6%) ÷ (96.6% -22.6%) = 0.776.
Brand B has more effective distribution in terms of the category sales as its index is higher (0.776 vs. 0.681).
Concentration curve can be created based on retail audit database, request to be sent to your Retail Audit agency. You can also build it by yourself based on Key Account off-take data.